Every shop reports its own way
Some send one line per sale. Others send a grid with a column for every store, two files that must be joined, or headers in another language. All of it has to become comparable.
Case study · Enterprise sales platform
Electrolux is a global appliance maker that sells in over 120 markets. The shops that sell its products send their numbers every month or week, each in their own file and their own layout. We built the internal platform where Electrolux teams load those files, check every line and keep all of it together in one trusted place, ready for the maps, charts and forecasts that guide manufacturing. I led the team that built it.
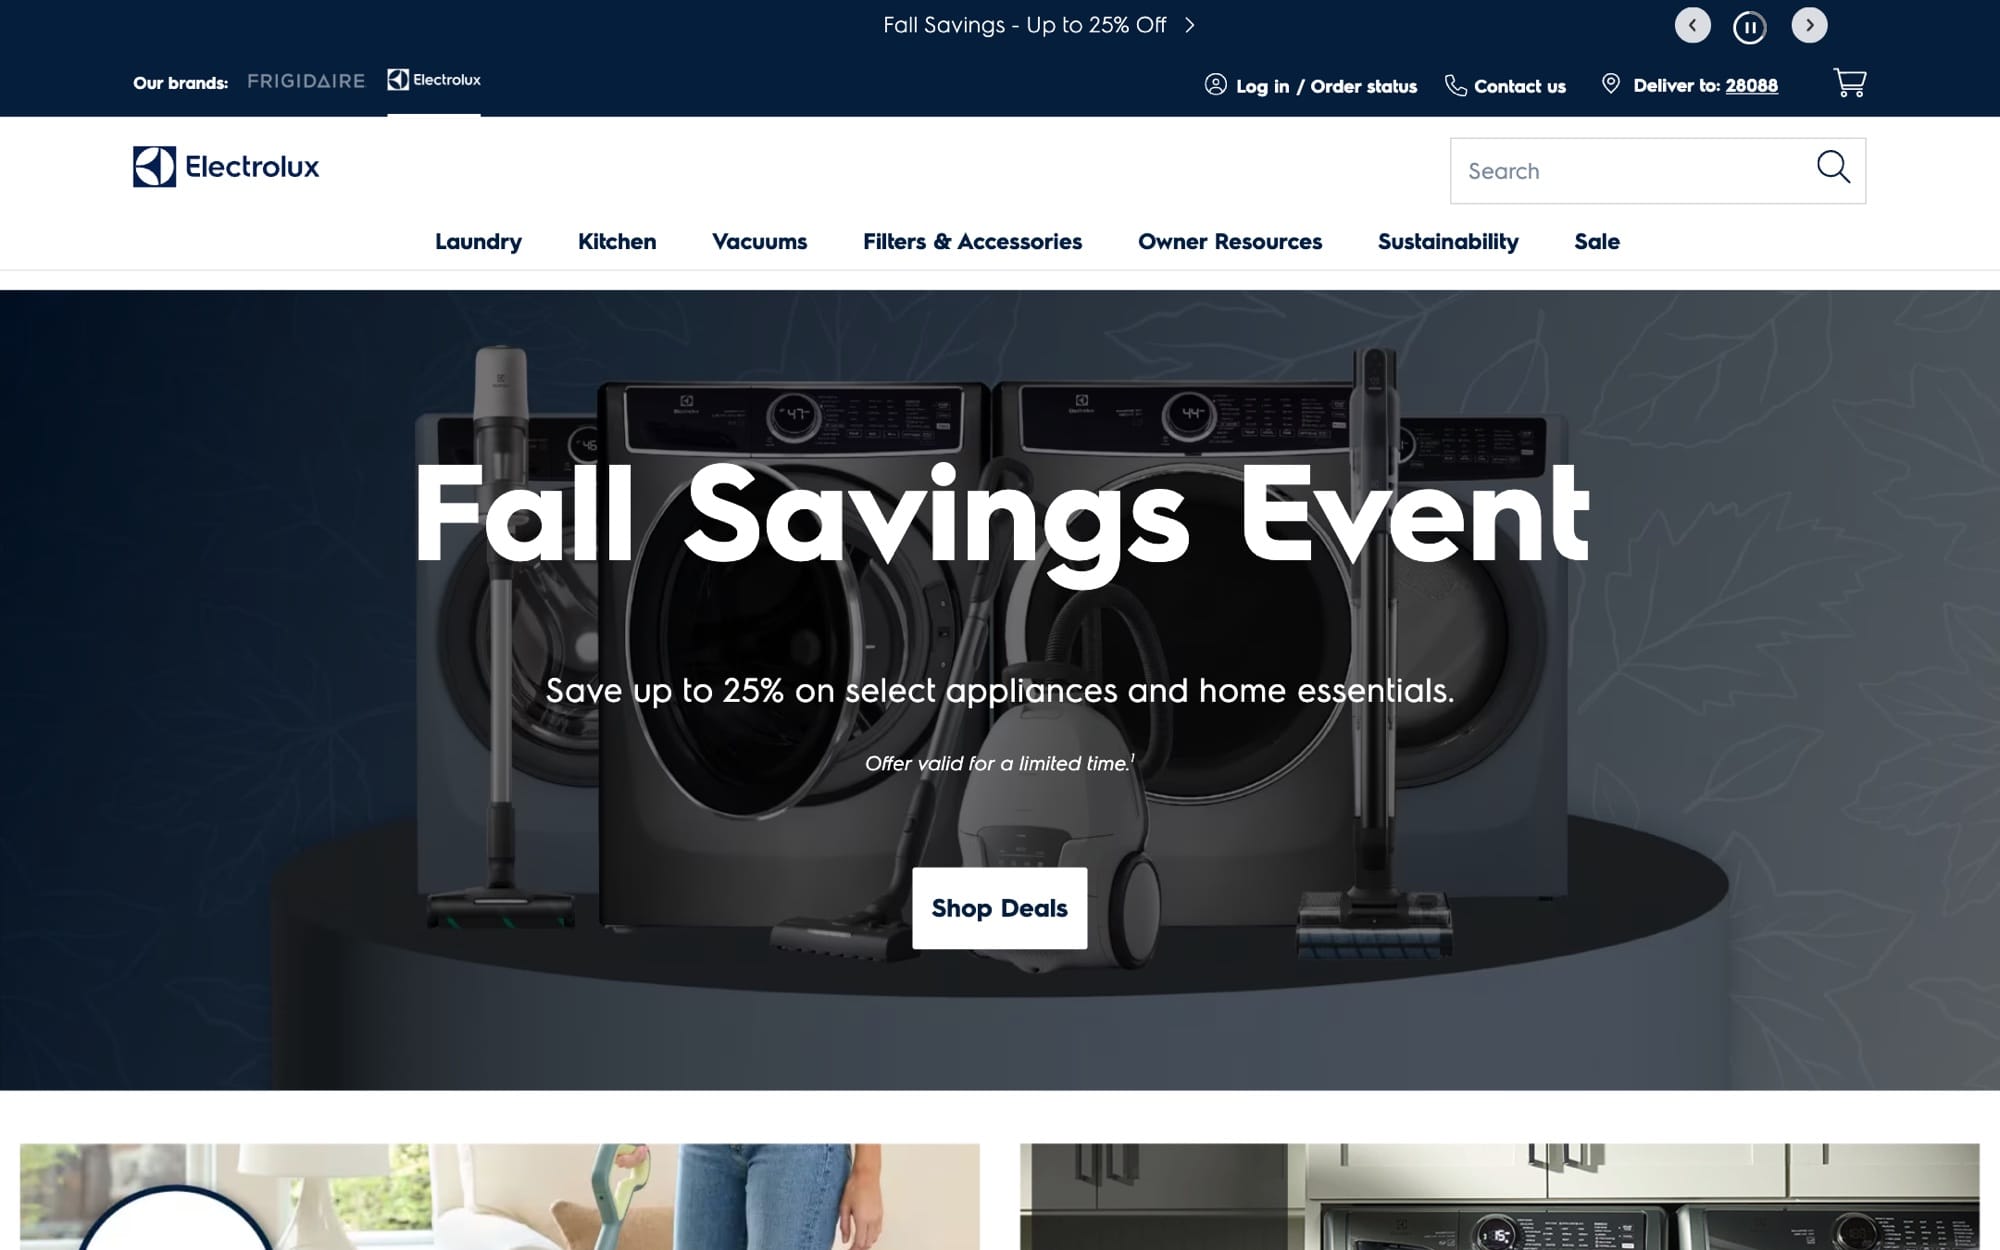
Electrolux's public website, October 2026. The platform we built is internal and private, so none of its screens are shown.
Visit www.electrolux.com/enFor everyone
Electrolux makes refrigerators, washing machines, ovens, vacuum cleaners and more, under brands including Electrolux, AEG and Frigidaire. It sells them in over 120 markets, through retail partners: the shops that put those products in front of customers.
Every month or week, those shops send Electrolux their numbers: which model sold how many units in which store, and for how much. Each country, and often each shop, lays that file out differently.
We built the internal platform where Electrolux teams load those files. It reads each layout, checks every line against the product and store lists, and saves everything in one place, in the same shape.
From that one source the company can see which model sold how many units, in which store, in which country, on a map. It can read the numbers through charts, including smart AI charts, and look ahead with sales forecasts that guide manufacturing.
I led the project as lead software engineer and managed a team of about 10 to 15 people. The platform is internal to Electrolux, so there are no screens of it on this page.
Every month or week, each partner shop sends its numbers in its own layout.
The platform reads every layout, checks each line and saves it all in the same shape.
Sales by country, store and model feed forecasts that guide manufacturing.
For founders and CEOs
What the business needed, why the platform was built this way, and what it gives the company.
Some send one line per sale. Others send a grid with a column for every store, two files that must be joined, or headers in another language. All of it has to become comparable.
A shop writes its store and model names its own way. 'Store A (Mall)' and 'EWF-8024' have to be recognised as the store and model Electrolux already holds, or the numbers cannot be added up.
Teams in different countries load data for the same periods. Two people must never overwrite each other, and a month that has been reported must not change quietly afterwards.
A system that only works when every shop reports the same way asks every partner shop to change. So the platform adapts to them: each account can have a rule that turns whatever layout arrives into the same line.
Trust comes before charts. Every line is checked before it is saved, a wrong name is mapped once and remembered, and nothing is ever deleted outright, so the numbers behind the maps and forecasts can always be traced.
The maps came from the first question anyone asks about sales, which is where. Smart AI charts help the team read the data faster, and the forecasts look ahead, so what is built at the factory can follow what the data says people will buy.
The value of the platform is in the questions it can answer. Each one depends on the same two things: every sale in one place, and every sale in the same shape.
A question about one product in one store gets the same kind of answer as a question about a whole country.
Electrolux teams now load their partners' numbers into one platform, with rules for the layouts of retail partners in Singapore, Thailand, Malaysia, Vietnam, New Zealand, India and Taiwan, and checks that keep the numbers trustworthy when many people work at once.
The teams read it through maps, charts and forecasts. Their feedback went straight back into the product: we presented the platform, listened, and reshaped the screens around what they told us.
I was the lead on this project: lead software engineer, hands-on developer and manager in one. I led the whole system, from how it was shaped to how it was delivered, and managed a team of about 10 to 15 people.
I also presented the platform to the internal teams who would use it, handled their feedback and reshaped the screens around it.
For engineers and technical leads
A React front end for loading and checking files, a NestJS API, and PostgreSQL holding every country's sales in one shape, with locks, approvals and an audit trail so the numbers can be trusted.
A team member picks the country, the account and the period, a month or a week from Sunday to Saturday, then chooses the file. The browser reads the Excel or CSV file itself and previews it in a grid.
They match the file's columns to model, store, quantity, value and date, and the choice is remembered for that country and account. Accounts with an odd layout have a custom rule that first turns the file into one line per model and store.
Validate checks every line: is the model known in this country, is the store found, are quantity and value numbers, is the date inside the period. Nothing is saved yet.
A name that is not found is mapped once, to a store or model Electrolux already holds, and found automatically from then on. Many at once are fixed with a bulk template.
Execute saves the lines in one database transaction. It first locks any upload already on file for the same country, account and period, so two people loading the same period cannot both decide from an empty answer.
An upload can be changed for 30 days. After that, deleting it, adding more or overwriting it needs an admin's approval, one approval for one action. A replaced upload is kept and flagged, never deleted, and every action goes to an activity log.
Maps, smart charts and forecasts read from this one source, so every country and store is counted the same way.
This was the hardest part of the project. Data came from partner shops in different countries, and every one laid its file out its own way: one line per sale, a grid with a column for every store, an amount in one file and the units in another, sales and stock side by side, headers in another language.
The platform had to be smart enough to understand all of them and turn each one into the same saved line: model, store, quantity, value and date. Every chart, map and forecast depends on that line being right. If two countries' numbers cannot be compared, the dashboard has nothing true to say about a product or a store.
Teams in different countries, and several people in one team, use the same data at the same time. The risk is easy to state and hard to prevent: two people load the same country, account and period at the same moment, each finds nothing there, and both loads land, so every sale counts twice.
Saving runs in one transaction that first locks whatever is already on file for that period. The second person waits, then sees the first person's load and chooses to add more or overwrite. A batch older than 30 days needs an admin's approval, and nothing is ever hard-deleted, so the data cannot be corrupted by two people at once.
A shop writes its store and model names its own way. The first time, the user links the name to the store or model Electrolux already holds, and the platform finds it by itself next time. A store link belongs to one account, a model link works for the whole country, and many at once go through a bulk template.
A replaced or deleted upload keeps its rows, flagged, so it can still show what it once held. The original file is kept too, so any upload can be traced back to what the shop sent.
Some shops send only units. For those accounts, value is price times units, with the price taken from the file, then from an uploaded price sheet for that month, then from the latest earlier month. A line with no price anywhere is rejected, never saved as zero.
A week runs Sunday to Saturday, and week 1 is the one that holds 4 January. Dates are read in the format each account uses. A return arrives as (500) or 500- and is saved as a minus number that comes off the totals.
An internal tool only works if people choose to open it. I presented the platform to the teams who would use it, took their feedback and reshaped the screens around what they said. There is a written guide inside the app, built on made-up examples, and a test plan that anyone can run.
The team builds a version of the platform, and I present it to the internal teams who will use it.
They use it on real work and tell us what is clear, what is missing and what gets in the way.
I decide what changes with the team, and the screens and the logic behind them are reshaped.
The improved version goes back to them, and the loop starts again.
Keep reading
Next case study
Internal product · Agency operations
One login for LinkedIn outreach, email from your own domain, scheduled posts, clients and staff. Clients and employees get a portal that shows only their own part.
AI product · Parenting
Oh Crap! Chat answers parents' potty-training questions with Jamie Glowacki's method, any hour. 700+ parents have paid for access.